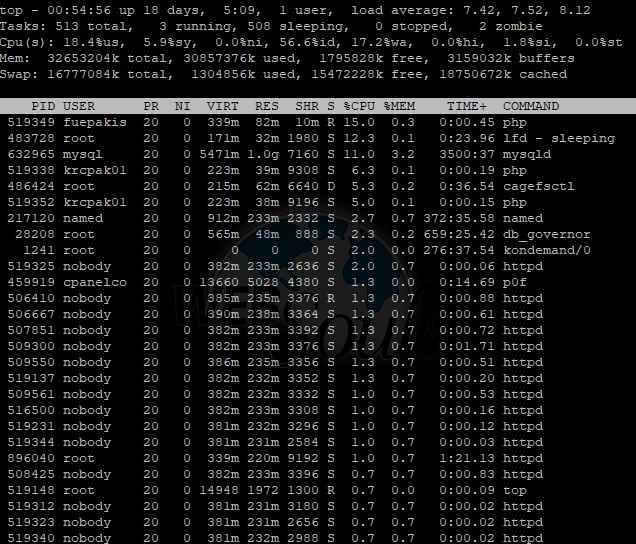
This article will help you how to monitor Linux process with the help of Top Command. The Top command is a much useful tool for a system administrator to monitor and take corrective action when required. Top command will display a full screen of information about the processes running on the system, as well as some information about the system. This includes load average, the number of processes, the CPU status, free memory information, and details about processes including PID, user, priority, CPU and memory usage information, running time, and program name. This article targets the audience which have Linux Based VPS or Linux Based Dedicated Server.
TOP: It will display the complete active process, CPU and memory information.
Shift + M: Will list process according to memory usage.
Shift + P: Will list the process according to CPU usage.
Shift + W: Used for saving the top command output in a file (/root/.toprc).
Shift + O: Used for sorting the process as per requirements.
First Row: It will tell about
- Current system time: 00:54:56
- System up time: up 18 days
- Current users: 1 user
- CPU average Load in 1/5/15 Min: load average: 7.42, 7.52, 8.12
Second Row: It will tell you about
- Total Process in Active Mode: 513 total
- Currently running process: 3 running
- Total Process in Sleeping mode: 508 sleeping
- Total Process Stopped: 0 stopped
- Total process in zombie state: 2 zombie
Third Row: It will tell about
- % CPU used by user process: 18.4%us
- % CPU used by System process: 5.9%sy
- % CPU used by nice value setting: 0.0%ni
- % CPU in Idle State: 56.6%id
- % CPU Waiting for I/O: 17.2%wa
- % CPU used by hardware interrupts: 0.0%hi
- % CPU used by software interrupts: 1.8%si
- % CPU used steal time: 0.0%st
Fourth row: It will tell about Memory.
- Total System Memory: 32653204k total
- Memory used By system: 30857376k used,
- Free Memory: 1795828k free
- Buffer Memory: 3159032k buffers
Fifth row: It will tell about Memory.
- Total Swap Memory: 16777084k total
- Swap Memory By system: 1304856k used
- Free Swap Memory: 15472228k free
- Cached Memory: 18750672k cached
Sixth Row: It will tell about
- PID(Process id): 519349
- User(User under which process is running): fuepakis
- PR(Priority of running process): 20
- NI(CPU Scheduling priority -20 low to 19 high): 0
- VIRT: 339m
- RES: 82m
- SHR: 10m
- S: R
- %CPU: 15.0
- %MEM: 0.3
- TIME+: 0:00.45
- COMMAND: php
The Top command indicates that the server is using all its resources you need to look at optimizing your current set up and this may include running any processing jobs at peak hours, killing the processes no longer required and reconfiguring processes so they require fewer resources. At last, you can increase your server resources to better match your requirements.
NOTE: Please remember that we do not support Linux command line via phone or live chat. You can ask for shell help via email to support@websouls.com or use one of the numerous websites which offer to teach shell.
We hope that the above article was beneficial to you if you liked it please give us a thumbs up.
Technical Support,
WebSouls.


